

overview
Speed up energy data analysis
The React Energy Portal minimizes the time you spend with the data, so that you can spend more time solving problems. Simply upload your data and immediately take advantage of insights from custom chart queries and weather data.

Upload your energy data
React makes it easy to upload 15, 30, and 60-minute data quickly so you can move on to what matters.
Bring your data to life
Move through your data at the speed of thought. With eight chart types and many custom queries you can minimize the time you spend analyzing data.

Weather Data API
Immediately see the effects of weather on energy consumption with raw weather data and degree-days calculations.


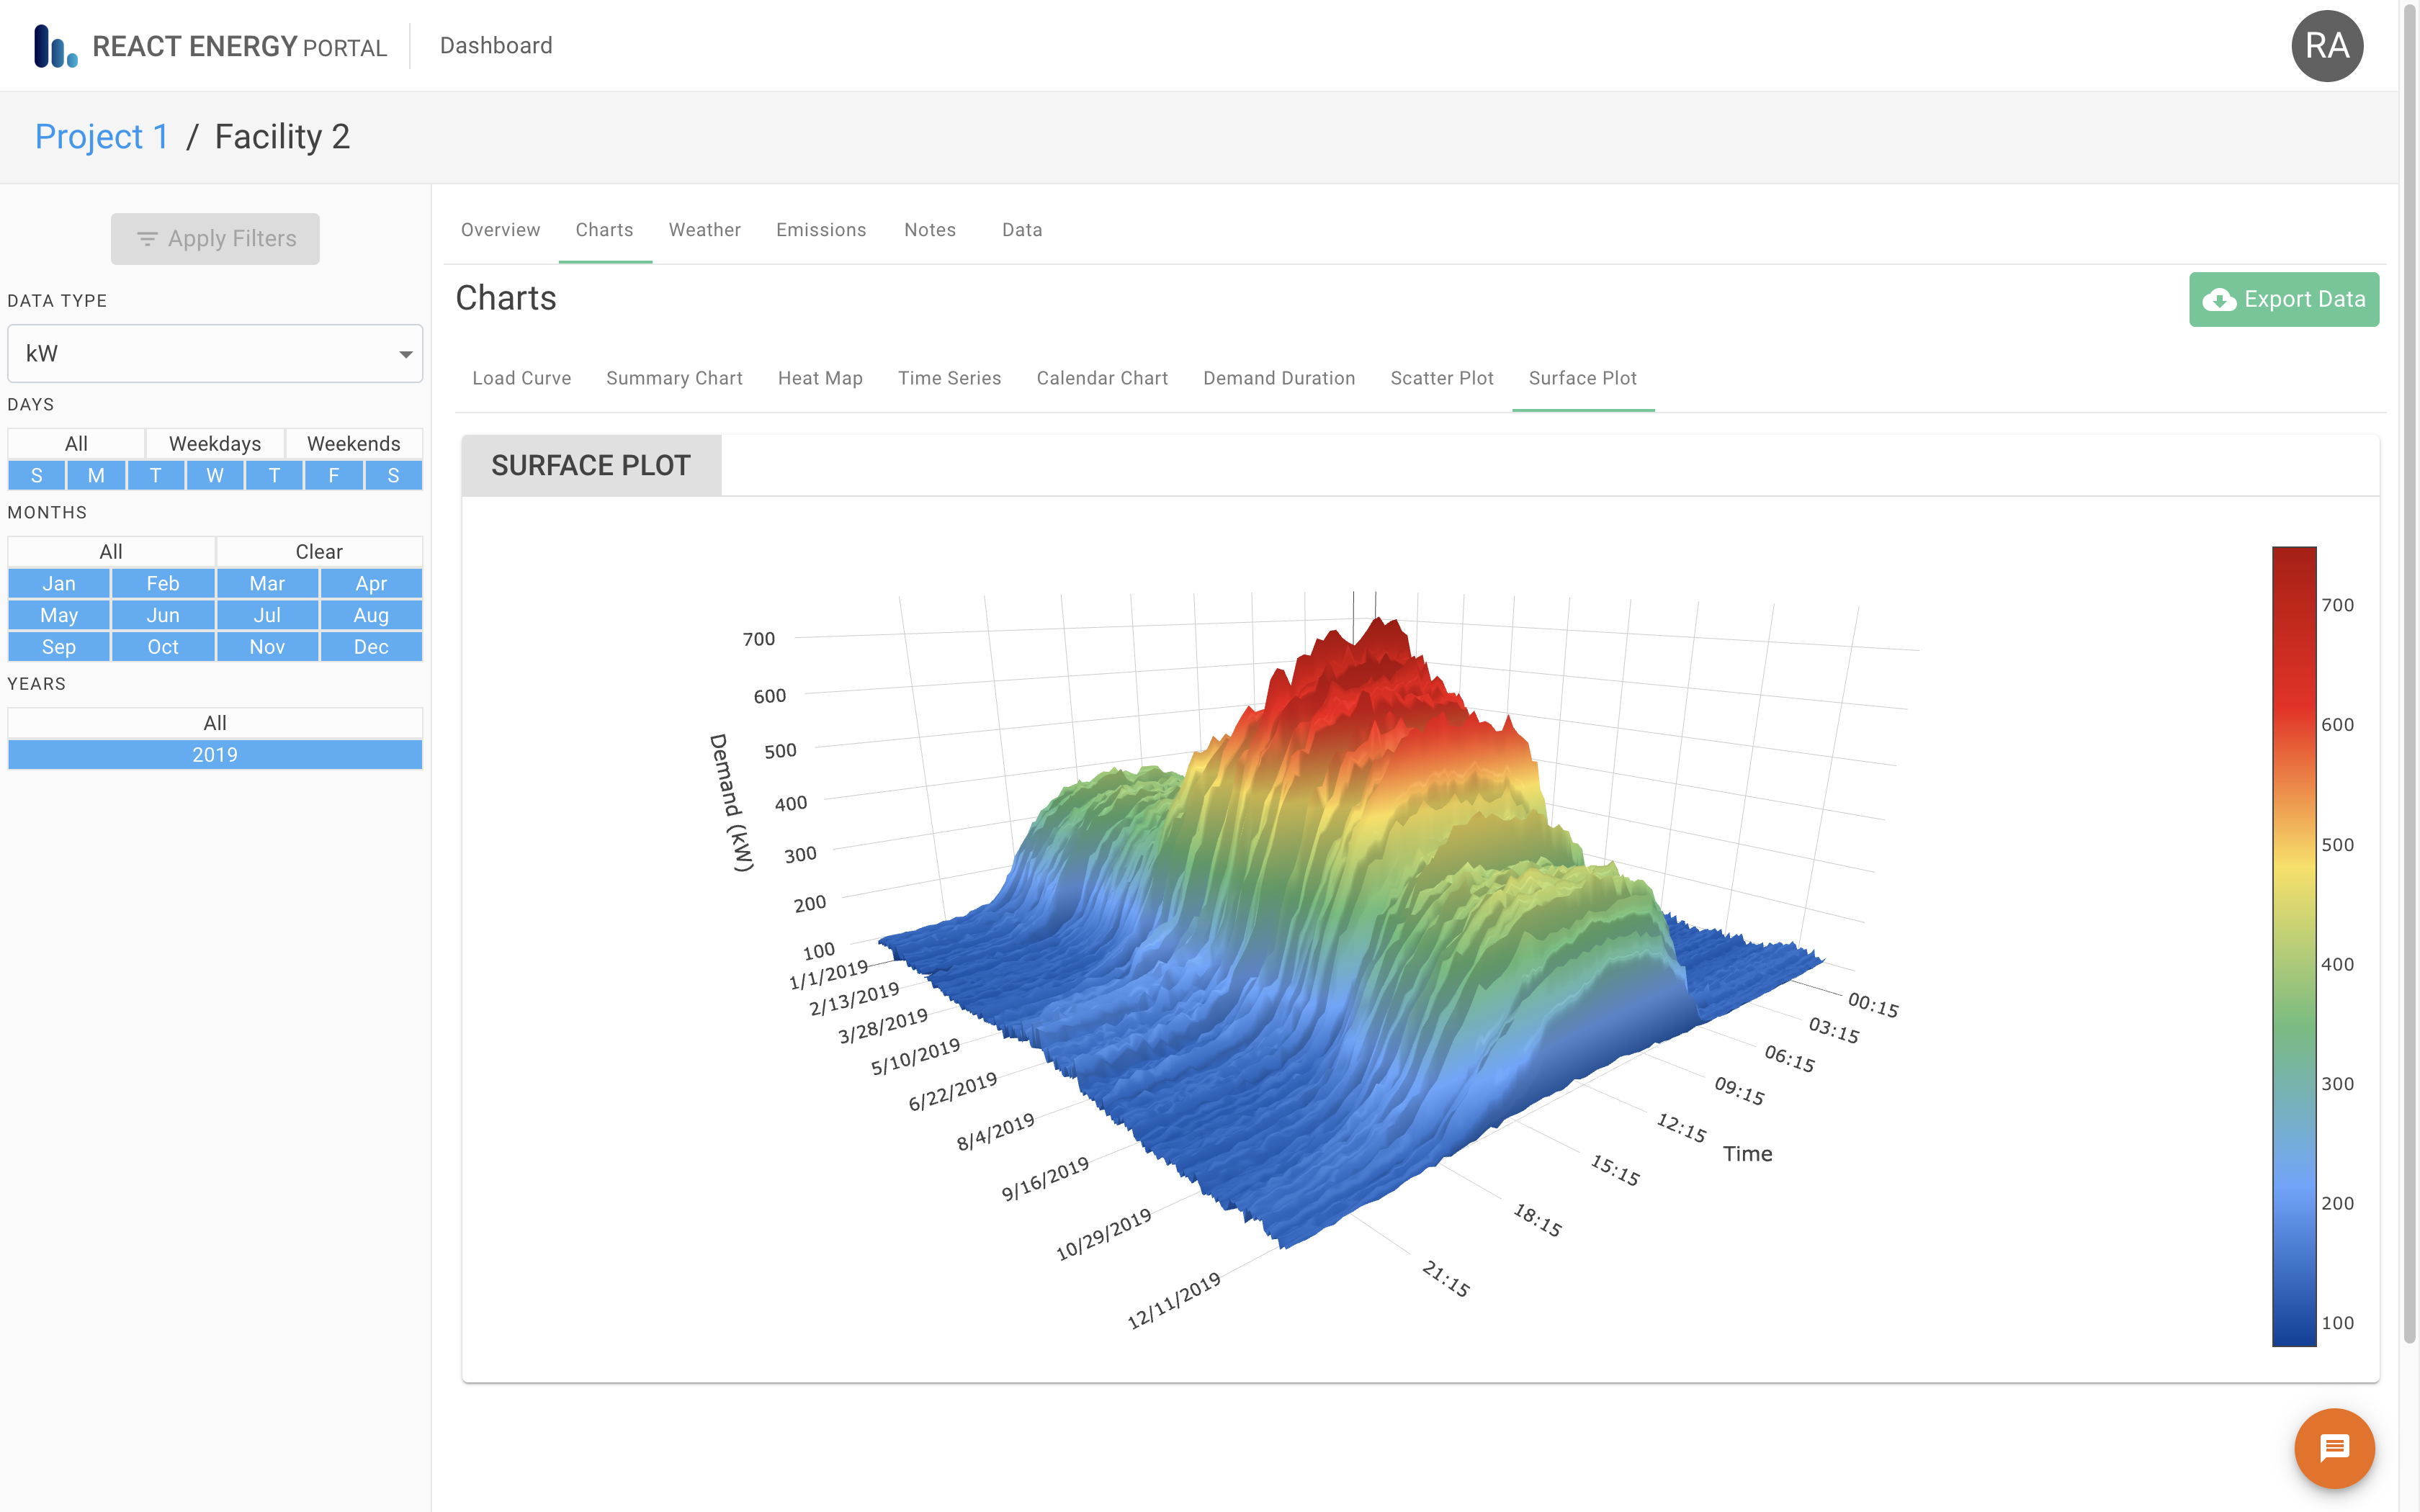
Charts
Charts designed for energy analysis
Find meaning in the data faster than ever with custom charting options designed to minimize the time you spend analyzing data.
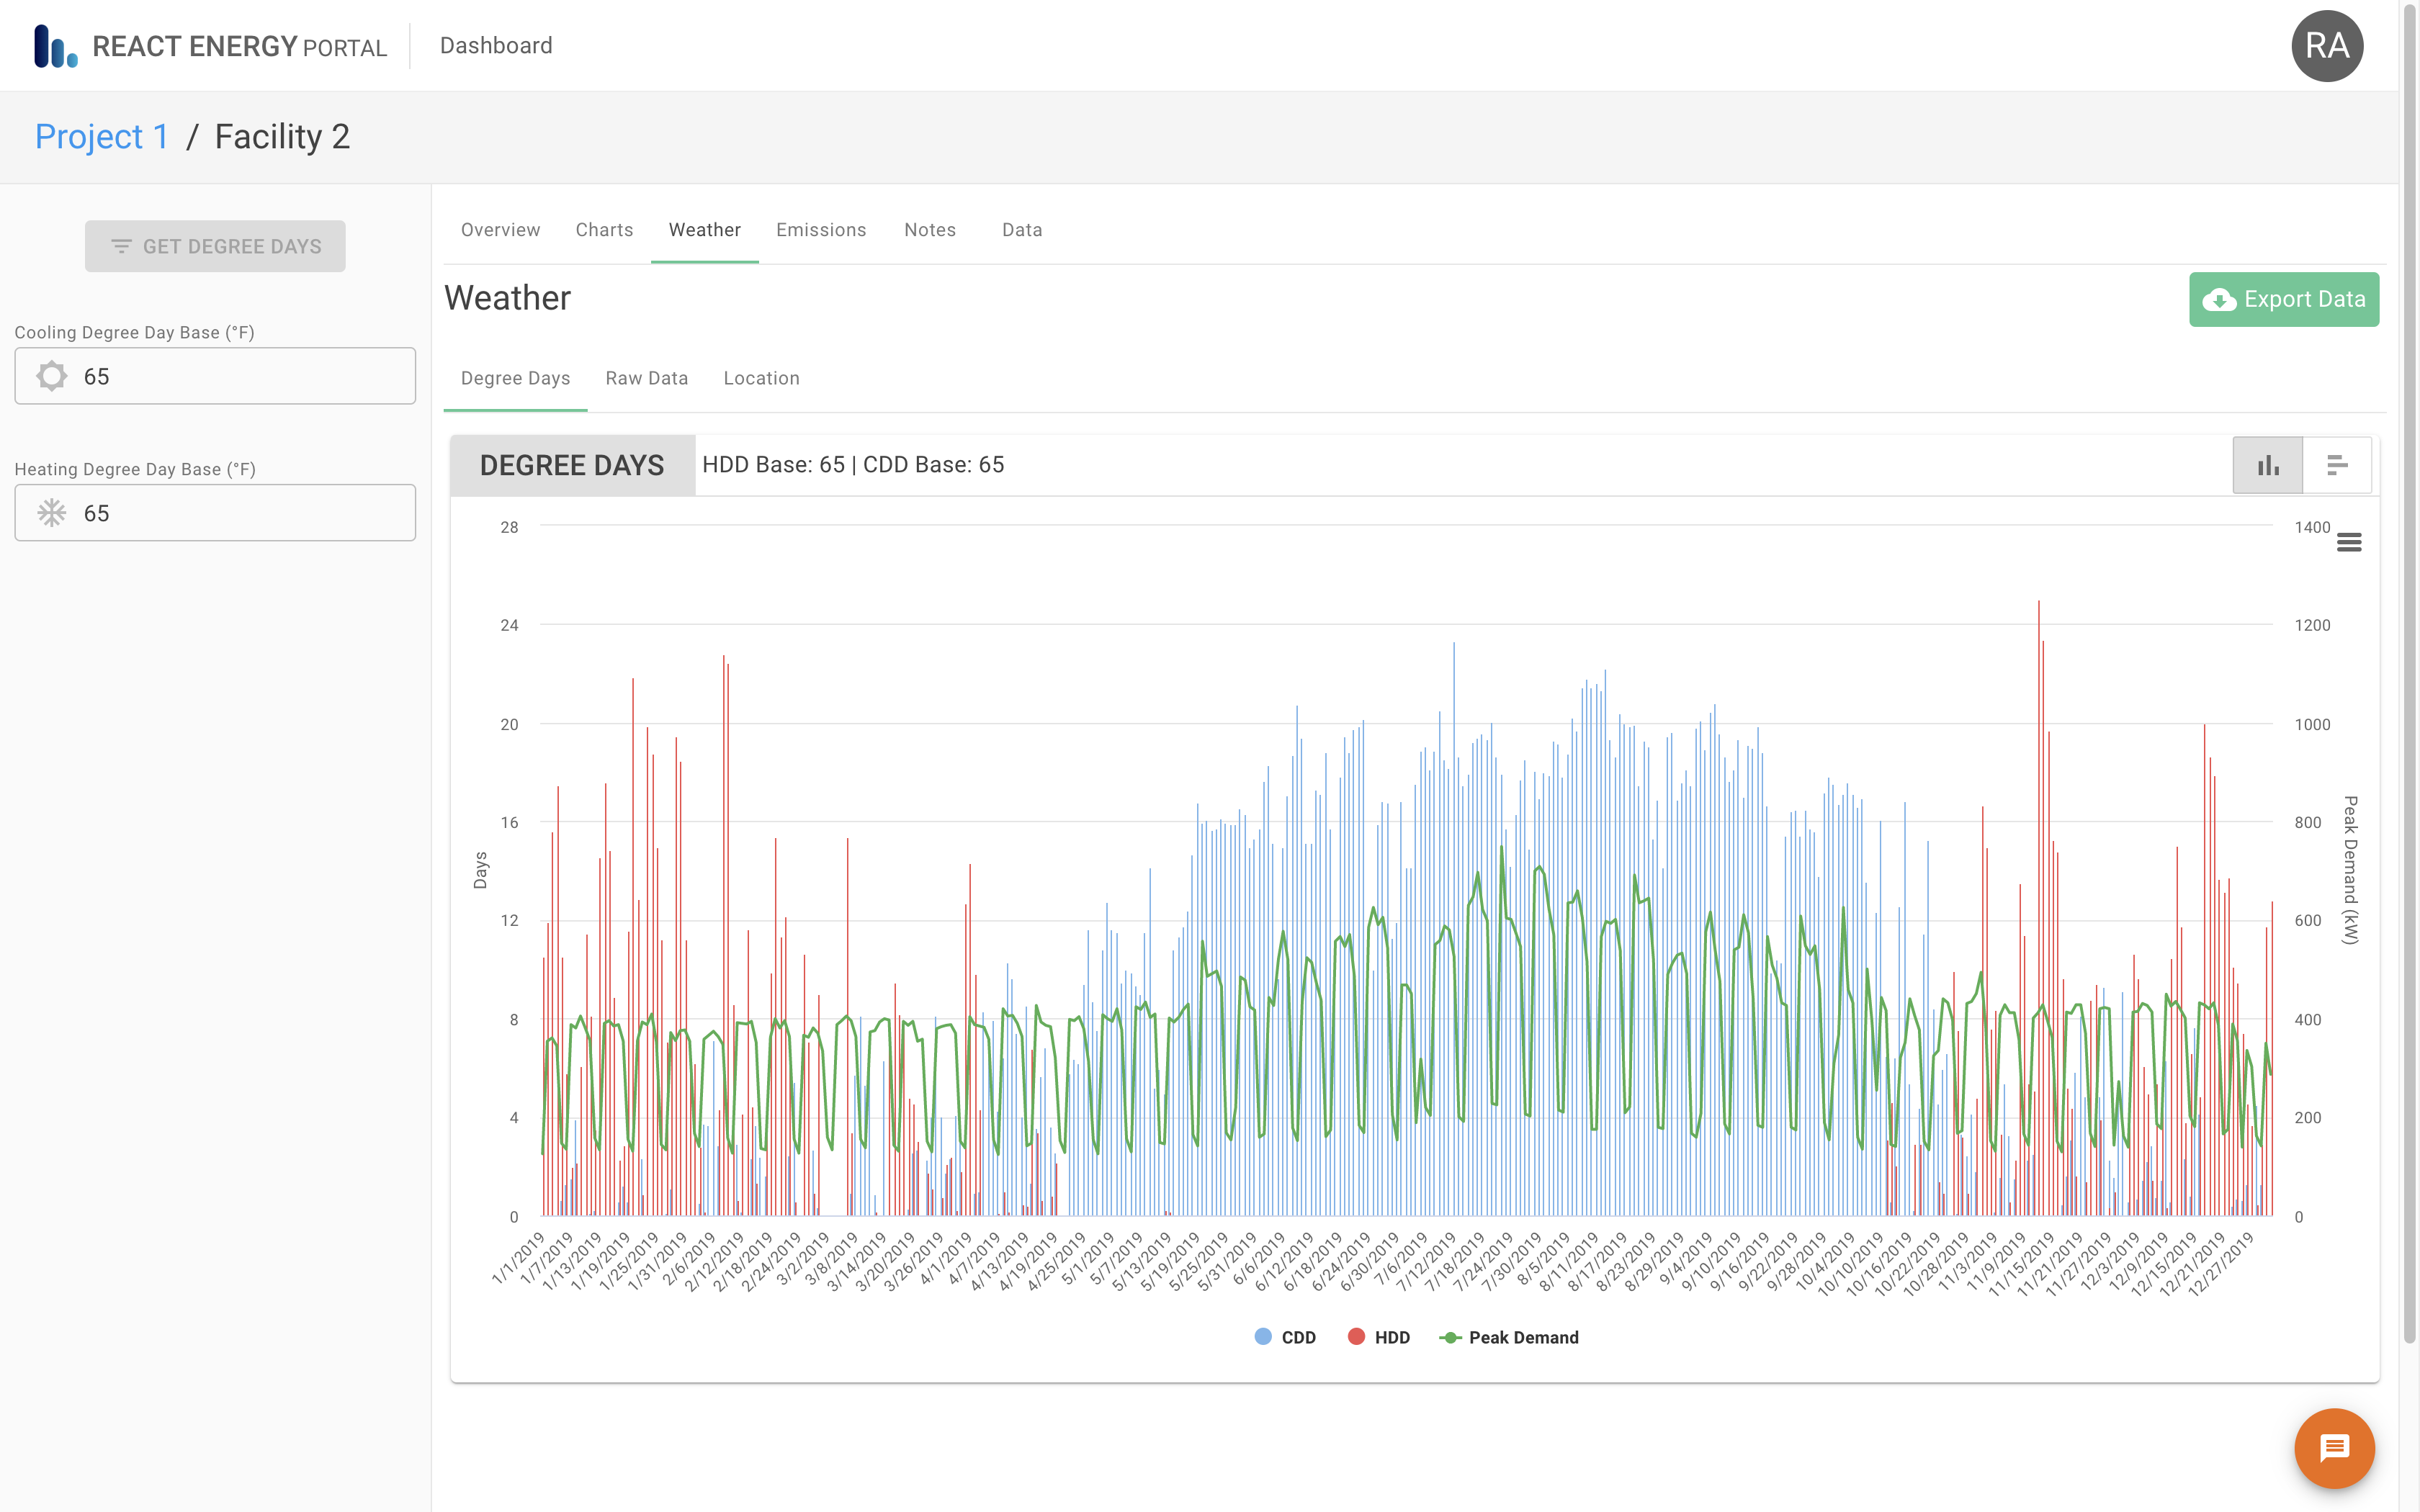
Weather
Leverage weather station data
Comparing energy consumption with weather data provides valuable insights into the operations of facilities. React searches nearby weather stations to provide you with high quality weather data.

Nearby weather stations
React pulls data from nearby weather stations based on postal code.
Multiple data points
React pulls in more than just raw temperature data. Acces data points such as humidity, dew point, precipitation, and more.

Degree days
Calculate degree days with custom cooling degree day and heating degree day base values.